The Inner Circle Trader
AI Audio Summaries
4 videos summarized
1 follower on BriefTube
Last summary: Sep 22, 2026
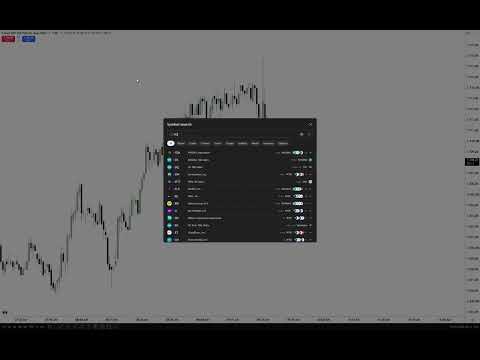
How To Engage Price After Holiday Volume Days
The speakers discuss market movements following a holiday, emphasizing a cautious approach by using paper trading to gauge market sentiment. They note a 100-handle premium gap opening and analyze price action relative to Friday's closing. Key elements include monitoring a wick's half, setting stop losses just above the second wick high, and aiming for sell-side liquidity within a suspension block, which is also a discount array. Nasdaq is observed to be softer than ES. The strategy post-holiday involves starting with one contract, even in paper trading, to align with price expectations. The importance of observing if the "sibi" (likely referring to an indicator or specific price level) remains open, even after retracement, is highlighted. Liquidity resting below a low and full gap closures are also points of interest.
Read AI summary
YouTube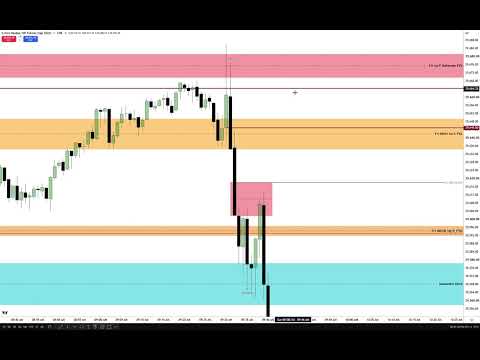
NQ Futures Review & 1st Presented Reflection FVG
The speaker reviews last Friday's trading, focusing on fair value gaps (FVGs) and their distinctions. He explains the difference between a "first presented fair value gap" and a "first presented fair value gap with displacement." The latter, characterized by being part of a price run that takes out a high or low, is given more emphasis, especially if it's the first one after 9:30 Eastern time. This concept was previously discussed in the Trader's Roundup spaces. He introduces a new concept: the "first presented reflection fair value gap." If the first FVG after 9:30 AM is a buy-side imbalance, sell-side inefficiency (BISI), then the "reflection" is the very first opposing FVG, a sell-side imbalance, buy-side inefficiency (SIBI), that forms afterward. This reflection FVG is crucial, particularly when it aligns with a macro timeframe inefficiency, as it helps in trading the day's high or low. He illustrates this with an example from Friday, where the first BISI was followed by the first SIBI (reflection FVG) at 10:01 AM.
Get automatic AI summaries for all your channels
BriefTube monitors your YouTube channels, generates AI-powered audio summaries, and delivers them wherever you listen. Telegram, Discord, Slack, or your podcast app. Fully automated.
Start free trial