Melt-Up Now, CRASH Later?
AI Summary
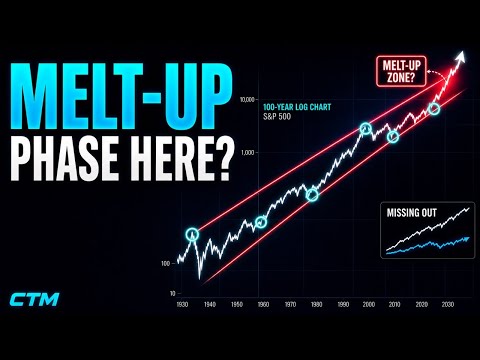
The market is currently exhibiting patterns that suggest a potential "melt up" phase, characterized by accelerated price behavior, similar to historical periods. Analyzing various charts, including the S&P 500, reveals significant structural breakouts and retests of long-term trend lines.
One key observation is a beauty breakout and retest of an upward sloping trend line on the S&P 500. This pattern, when seen in an upward sloping channel, often leads to accelerated price action. Conversely, a breakdown from a downward sloping channel typically leads to accelerated decline or a liquidity grab. The current market behavior, with a breakout from an upward channel, indicates a potential melt up.
Comparing the current S&P 500 trajectory to 1997 and 1998, which saw back-to-back 20% gains, suggests a fractal pattern. The question is whether this is a repeat of the dot-com bubble's run into a bust, or if "this time is different." If it is a melt up, prices could go significantly higher, with targets around 7700 on the S&P 500 being discussed. However, a failure to stay above critical support lines would be a devastating technical event.
Examining a quarterly chart of the S&P 500, a massive upward sloping trend line going back 100 years, since the Roaring 20s, shows a clear breakout. The dot-com bubble top was a perfect touch on this parallel channel's top support line, followed by a massive correction. The current validation of this century-old structure, with a breakout, is a significant event.
A newer structure, formed since the 2022 bear market, also shows confirmation with multiple touches. This structure suggests a target of around 7700 on the S&P 500, representing a structural top previously seen after periods of quantitative easing.
While the market is showing strong upward momentum, it's not yet in a "mania phase" akin to the dot-com bubble or the 2017 altcoin boom, where anyone could pick a stock and see massive gains. However, if the melt up takes hold, it could lead to such a phase.
The Nasdaq is also approaching a critical resistance level. Despite geopolitical tensions, particularly concerning the Strait of Hormuz, the market seems to be absorbing the situation, with oil prices around $100 a barrel. However, this is a precarious situation that could quickly escalate and have damaging effects on crude prices and the broader market.
Other market indicators are also being closely watched. Crude oil is trading at $102 a barrel. Ten-year and long-term yields are being monitored for potential breakouts, which could be devastating. The job market remains resilient, and ISM services and manufacturing PMI are growing, which are positive signs.
Bitcoin and crypto are currently leading or moving with tech, which is seen as a powerful trend. Tech is expected to lead as the Fed began raising its balance sheet, and Bitcoin was expected to stabilize and ascend, which is now occurring.
The dollar has experienced a devastating breakdown, awaiting developments in the current geopolitical situation. The Bank of Japan is actively intervening in markets, burning money. The question arises if the next move for the dollar above 160 will lead to a significant rally.
Bitcoin is attempting to hold a breakout above a bear flag/channel. A sustained breakout on the daily chart is crucial. If it holds, a target of around $87,000 for Bitcoin is projected, based on historical support levels derived from the Grayscale court decision and a liquidity grab in September.
Looking at the previous cycle high for Bitcoin, the current structure suggests that while not entirely out of the woods, the outlook is more favorable. The 87,000 target is a significant pain point to get through before price discovery.
A discussion about a trader named Kirsten, who turned $5,000 into $100 million before losing 60% of it, highlights important lessons: avoiding trading without a clear setup, lack of situational awareness (not being ready for a bear market), taking positions too large for the account, and overtrading. The importance of sticking to a system and diversifying is emphasized.
The cost of non-participation in the current market rally is widening, with the S&P 500 dramatically outperforming even Warren Buffett, who has a significant cash position. This highlights the potential opportunity cost of not being invested during a melt up.
The market is being driven by rising earnings and significant capital expenditure (capex) spending, estimated at $1.1 trillion for 2027. A pullback in capex spending would be a major red flag. Other red flags include oil above $120, which would have significant consequences, and a blowout in yields.
Treasury buybacks, initially forecasted at $20 billion, have increased to $164 billion, indicating ongoing market intervention and a form of yield curve control. Corporate buybacks are also at all-time highs for 2026, contributing to an "artificial engineering of stock market price."
The job market remaining intact contributes to passive flows into retirement accounts, further fueling the market. However, if passive flows stop, buybacks regress, or earnings regress, these would be major red flags. Currently, none of these are happening, though oil prices remain elevated.
The current market move is largely led by semiconductors, with massive revenue projections. While some point to market breadth concerns, arguing that few stocks are above their moving averages, historical data suggests that major bull runs often begin when participation (percentage of stocks above moving averages) is extremely low, only to improve as the market rises.
The possibility of a productivity boom led by humanoid robots and AI advancements, along with potential IPOs like SpaceX or ChatGPT, could lead to a market liquidity event and a transition into the AI age.
Historical chart analysis suggests that the current market position relative to the dot-com bubble peak indicates a significant portion of the move (35-40%) may still be ahead. A farmer's chart from 100 years ago, predicting market tops, accurately aligns with historical events and suggests a potential top in 2026 or 2027, followed by a mass deleveraging event between now and 2032.
The current strategy involves staying on the right side of the market with strong emotional awareness, utilizing a "Hive Mind, collective collaboration" approach to navigate the complexities. The portfolio is showing strong performance, with most positions in profit, indicating the effectiveness of the current strategy.