NQ AM Session Low Of Day Long Review
Audio Summary
AI Summary
The speaker, having returned from a road trip, shares insights into NASDAQ price action, focusing on daily and one-minute charts. He discusses two trades executed today, one of which was a deliberate challenge to social media pundits who deny the existence of macro influences in trading. The speaker aims to demonstrate the simplicity of his approach.
He begins by examining a specific portion of the daily chart. Playing devil's advocate, he considers a bullish outlook, which was his initial expectation for the day due to indications like relative equal highs and buy-side liquidity, as well as price's reluctance to move lower recently. He references a wick on the daily chart and a volume imbalance, which from a bullish perspective suggested upward movement. Price had traded down last Thursday and then closed higher.
Observing such formations, the speaker emphasizes the importance of the midpoint or "consequent encroachment" of the wick. Measuring from the close of the candlestick down to its low, he notes the price at 30,566.25 at the close of electronic trading hours. The fact that price did not close above this midpoint is a slight concern, and he plans to observe the opening at 6:00 p.m. Eastern time and subsequent trading into midnight for further indications, especially since price traded below last Thursday's low of 30,370. This level is marked as a sell-side liquidity pool, while the 30,568.50 level (the halfway point of last Thursday's discount wick) is kept green.
Transitioning to the one-minute time frame, the speaker mentions the absence of significant economic data today, although it is a non-farm payroll week. He advises new students to generally avoid trading on Mondays due to the potential for consolidation, which can be challenging to navigate. He clarifies that his past comments about not trading Mondays or Fridays have often been taken out of context by those trying to market their own ideas.
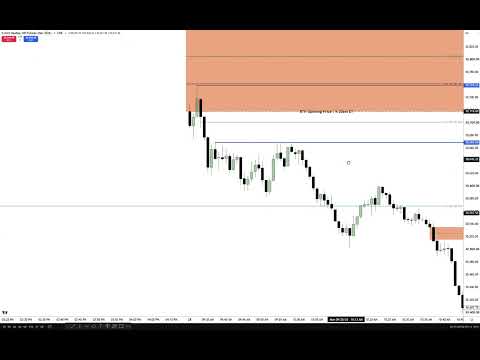
He then analyzes the regular trading hours (RTH) opening range gap. Price opened lower than the previous Friday's settlement, creating a "discount regular trading hours opening range gap." Using a Fibonacci tool anchored from last Friday's RTH settlement close to today's 9:30 AM Eastern time opening price, he grades this gap.
The speaker highlights a crucial observation: after opening lower and moving slightly lower, the subsequent candlestick traded up but *failed to touch* the lower quadrant level of the opening range gap. This failure in delivery to a key level, despite normal expectations for price to at least reach the lower quadrant before potentially selling off, is a strong indication of weakness. A normal bullish function would involve trading up to the lower quadrant, hitting some sell-side liquidity, shifting market structure, and then potentially returning to the half-gap or higher. However, given the failure to even reach the lower quadrant, the market was signaling weakness.
He then introduces the concept of "real order flow" as opposed to the "Mickey Mouse" mythology promoted by many educators who focus on past execution data. True order flow, according to the speaker, is algorithmic and predictive, focusing on what price is likely to do next based on its interaction (or failure to interact) with key levels. He illustrates this with the candlestick's body failing to close on or above the lowest octant level of the gap, signaling bearishness. He dismisses volume profile, Goldbach, and similar concepts, stating they have no bearing on algorithmic behavior and are akin to predicting today's weather based on yesterday's.
The speaker reiterates two key bearish signatures: the candle high failing to reach the lowest quadrant, and the bodies of the subsequent candlesticks failing to lay on or above the lowest octant of the RTH opening range gap. This indicated a strong likelihood of lower prices.
He then discusses a personal trade executed during the pre-session hours, a scalp that yielded $6,990. This trade was partly motivated by a desire to prove the validity of "macros" – specific times when price tends to "spool" or move significantly, independent of volume. He recounts an interaction with a social media user who, after the speaker posted his trade, attributed the market movement to news about US-Iran talks, implying the speaker was not a "professional trader" for not acknowledging this. The speaker firmly rejects the idea that news headlines can be consistently profitable, having tried and failed with such methods in the past. He deduced that the retail perspective, influenced by this news, was bullish, creating a "diametrically opposed" setup for him.
Given the bearish signatures and the bullish retail narrative, the speaker anticipated price being drawn down to last Thursday's low (30,370), which he had identified as a strong liquidity pool. He then demonstrates how standard deviations of the RTH opening range gap align with this target. He shows how the -1 and -2 standard deviation levels progressively move closer to the 30,370 liquidity pool. The -2 standard deviation level perfectly converged with last Thursday's daily low, a precision he claims is absent in other trading methodologies.
He then switches to electronic trading hours, showing how the market dropped into this confluence of the 30,370 low and the -2 standard deviation. He highlights that the bodies of the candlesticks did not close at or below this combined level, signaling a bullish reversal according to his algorithmic order flow principles.
The speaker strongly criticizes those who dismiss macros, even some of his own students, calling them "neophytes" who misunderstand the concept. Macros are simply "spooling times" when large institutions space out their orders, leading to price movement regardless of volume. These occur during the last 10 minutes of an hour and the first 10 minutes of the next (e.g., 10:50-11:10 AM Eastern time). He asserts that understanding these macro times, along with liquidity and narrative, provides a superior, scientific understanding of market movement.
He recounts how the market indeed traded down to the two standard deviations of the open range gap and last Thursday's low, running against the retail bullish narrative. The price swept this liquidity, creating a wick. He then identifies a "fair value gap" and, nearing the midpoint of the macro time, anticipates a strong spooling in the latter half.
The speaker emphasizes the precision and uniqueness of his teachings, promising that anyone who studies his methods for a year will gain an unparalleled understanding of price action, negating the need for courses, books, or services. He also takes a moment to address disrespectful email practices from some followers.
He reaffirms that the market's failure to close below the second standard deviation or last Thursday's low signals a bullish intent. He then details his entry, which occurred inside an "inversion fair value gap" after price showed bullish signs. He explains how price then rallied, using the initial 9:30 AM opening price as a magnet and various gaps and institutional order flow entry drills as support, ultimately taking out relative equal highs and reaching a wick's consequent encroachment. He notes his exit when price bodies remained within the upper half of a specific wick and failed to close above the 9:30 AM opening price or the low of the RTH opening range gap, indicating a lack of willingness to go higher.
He concludes by stressing the secret perspective offered by macros, which are distinct from coincidental price movements at other times. He asserts his methods are "technical science," not "Mickey Mouse," and consistently deliver precision unmatched by other traders. He challenges anyone to demonstrate a better execution strategy, confident that his techniques, even these "simple" ones, are superior. He reiterates the core elements of his analysis: liquidity, time, and narrative, explaining how the public's bullish expectations were used to "rug-pull" price lower, where he was waiting to enter.