NonFarm Payroll October 2026 Lecture
AI Summary
The speaker discusses non-farm payroll price action, focusing on a regular trading hours chart that shows a gap formed on Friday, a shadow sharing space with Monday's opening range gap, and Thursday, Wednesday, and Tuesday's market activity. He explains that by using a template that includes new day, new week, and regular trading hours opening range gaps, one can observe shared spaces that become significant.
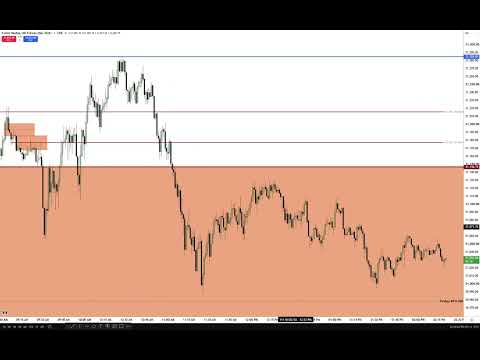
He points out that on Thursday afternoon, the market traded to the high of Tuesday's regular trading hours open range gap, then oscillated between the consequent encroachment of Thursday's gap and Monday's high. Early trading hours on Friday saw a significant upward movement. The speaker references a previous projection for higher prices on the daily chart, specifically mentioning the June 22nd, 2026, December NQ (NASDAQ futures) contract daily high of 31,285. This level is crucial for lower time frame analysis.
Transitioning to a one-minute electronic trading hours chart, the speaker highlights the 9:30 AM opening price and a subsequent drop. He wanted to see if the price could reach a specific lower area, even if it was ultimately going to surpass previous highs and make an all-time high. The non-farm payroll numbers were released at 8:30 AM. The speaker advises against positioning oneself before such high-impact news, calling it "gambling." He emphasizes waiting 15-20 minutes after the news release to observe market liquidity and what patterns emerge.
He details how to frame the 8:30 AM price action by identifying the lowest low and highest high within the 7:00 AM to 8:30 AM range. Using a Fibonacci tool anchored to this low and high, he explains the concept of an "event horizon." After the initial surge following the 8:30 AM news, a short-term high formed around 8:38 AM. This high, combined with the older June 22nd daily high of 31,285, creates an "unrealized dealing range." The speaker explains that this allows for prediction rather than reaction. He forecasts a short opportunity in this vicinity.
He reiterates his caution against trading non-farm payroll directly, stating that his methods are for advanced students comfortable with contrarian, short-term scalping against the daily trend. He believes that trying to guess the market's reaction to news, regardless of the numbers, is gambling, drawing on 34 years of experience where markets often do the opposite of what data suggests. He warns against chasing fast money, as it often leads to giving back profits due to impatience.
Instead, he focuses on capitalizing on the market's structure after the initial news reaction. By identifying the short-term high after the news and the older daily high, he calculates the midpoint of this unrealized dealing range, which serves as his "event horizon." He then brings in the pre-market session hours between 7:00 AM and 9:00 AM, specifically adjusting for the 8:30 AM news event. He uses the high and low of the 7:00-8:30 AM range, anchored with a Fibonacci tool, to identify a midpoint level.
He demonstrates how adding specific Fibonacci levels (e.g., -1, -0.5, -2, -2.5) can align with key price points. He reveals that the -2.5 level aligns precisely with his calculated event horizon, a convergence he asserts is not found in retail trading books. This convergence provides a high probability area for a trade.
The speaker explains his premise: after the initial rip higher at 8:30 AM and a subsequent pullback and another rip, he anticipates a deeper retracement in relation to the initial 8:30 AM starting point. While not an everyday scenario, this volatility-based, news-driven setup, when it forms, offers a clear directional bias. He emphasizes not chasing the initial move but waiting for the market to reveal its hand. The market often engineers sell-side liquidity below the highs, creating opportunities for shorts.
He then details his execution strategy. He entered three short contracts early when the candle was bullish, added three more at the event horizon (the red line), and then one more as price passed lower. He anticipated price drawing back down to take out engineered sell-side liquidity. He highlights a subsequent candle that failed to touch the consequent encroachment of a fair value gap, indicating weakness and confirming his bearish bias. He emphasizes that candlestick open, high, low, and close provide all necessary information for understanding order flow, without needing complex indicators or volume analysis. He likens relying on majority action to being a "herd animal," preferring to act like an "apex predator" by identifying weak points in the market.
He explains that the failure of a candlestick to reach the midpoint of a buy-side imbalance/sell-side efficiency, coupled with a bearish order flow from the highs, confirms the expectation of a draw down into sell-side liquidity. He stresses the importance of understanding the distribution of wicks, highs, lows, and body closes relative to opens.
He contrasts his predictive approach, using the event horizon, with volume profile trading, which he views as analyzing what has already happened. His method focuses on knowing where price should fail and gravitate to, simplified by candlestick behavior in the futures market, where everyone sees the same open, high, low, and close. He states that mastering the concept of "draw on liquidity" and a few key PD arrays (inversion fair value gap, bullish/bearish fair value gap, breaker, immediate rebalance) provides 80% of the game. He cautions against trying to apply every concept from his channel to every trade, encouraging students to focus on what they identify easily. He also advocates for daily backtesting and journaling.
He further explains that the market's failure to get to the upper half of the range, staying in the discount range or briefly wicking into the premium before quickly leaving, indicates weakness. He demonstrates how he took partial profits at specific levels, like a fair value gap and a rejection block, and adjusted his position as the market became indecisive. His final two contracts were stopped out at a trail stop loss.
He concludes by reiterating his preference for fading the non-farm payroll number after the initial burst, attacking those who try to participate in the initial 8:30 AM run. He emphasizes that avoiding these high-impact news events (NFP, CPI, PPI) is crucial, as they are often used to hurt traders, even when data seems to support a particular direction. He stresses that it's impossible to react to the data, determine an order, and execute it in real-time, and that limit orders are ineffective due to speed. He advises waiting for a meaningful retracement after the news to establish a high to measure off of, then using that to find the event horizon for a contrarian trade. He likens this to "surfing where the big waves are," going against the grain of the initial news reaction. He notes that this strategy can yield significant profits, referencing a trade that made just under $25,000 in less than half an hour. He highlights the market's behavior after his trade, showing it eventually hit his target levels with clear price action and specific PD arrays. He also points out a "rejection block" where bodies stopped, indicating another key level.